Stormlog in real workflows
Stormlog is most useful when you stop thinking of it as “a profiler library” and start thinking of it as a debugging loop:
capture the smallest truthful signal
save it as telemetry or a diagnose bundle
inspect it in the CLI or TUI
decide whether the problem is model behavior, runtime behavior, or environment drift
This article focuses on how that loop fits into daily work.
Why memory issues are hard to debug
The failure mode is usually delayed:
a training loop looks fine for minutes, then OOMs
allocator reserved memory grows while allocated memory looks stable
one rank starts drifting before the rest of the job notices
a CI run only fails on one backend or one Python version
Most teams do not need a giant dashboard first. They need a way to capture a truthful sample, keep it portable, and revisit it later without recreating the whole run.
Stormlog’s value is that the same toolkit supports:
Python-level profiling for bounded operations
CLI-level telemetry capture
terminal-first artifact review in the TUI
The three daily workflows
1. ML engineer instrumenting a training step
This is the workflow for answering:
how much memory does this step cost?
what is the peak?
did this code change shift the allocator profile?
PyTorch path
GPUMemoryProfiler is the right tool when the question is local to one
torch.cuda-backed operation. In practice that means NVIDIA CUDA builds and
ROCm-backed PyTorch builds surfaced through torch.cuda.
import torch
from stormlog import GPUMemoryProfiler

profiler = GPUMemoryProfiler(track_tensors=True)
device = profiler.device
model = torch.nn.Linear(1024, 256).to(device)

def train_step() -> torch.Tensor:
    x = torch.randn(64, 1024, device=device)
    y = model(x)
    return y.sum()

profile = profiler.profile_function(train_step)
summary = profiler.get_summary()

print(profile.function_name)
print(f"Peak memory: {summary['peak_memory_usage'] / (1024**3):.2f} GB")
If you are on Apple MPS or a CPU-only host, switch to MemoryTracker, the
CLI, or the TUI monitoring flows instead of GPUMemoryProfiler.
TensorFlow path
For TensorFlow, the context-manager flow is the clearest equivalent:
from stormlog.tensorflow import TFMemoryProfiler

profiler = TFMemoryProfiler(enable_tensor_tracking=True)

with profiler.profile_context("training"):
    model.fit(x_train, y_train, epochs=1, batch_size=32)

results = profiler.get_results()
print(f"Peak memory: {results.peak_memory_mb:.2f} MB")
What to do with the result
If the issue is isolated to one call, stay in the Python API. If the issue only appears over time, move to the tracker workflow.
2. Researcher or debugger chasing a memory regression
This is the workflow for answering:
why is memory still growing even though the step profile looks fine?
is this a leak, fragmentation, or just a bigger steady-state footprint?
did this regression show up only after a certain runtime change?
Start with telemetry, not screenshots
Use the CLI tracker first:
gpumemprof track --duration 30 --interval 0.5 --output track.json --format json
gpumemprof analyze track.json --format txt --output analysis.txt
gpumemprof diagnose --duration 0 --output ./diag_bundle
For TensorFlow:
tfmemprof monitor --interval 0.5 --duration 30 --output tf_monitor.json
tfmemprof analyze --input tf_monitor.json --detect-leaks --optimize --report tf_report.txt
tfmemprof diagnose --duration 0 --output ./tf_diag
Then load the artifact into the TUI
The TUI is useful after you already have data:
Monitoringtells you whether a live session is actually producing eventsVisualizationsrenders and exports the current timelineDiagnosticsreloads live telemetry or saved artifact paths
What the workflow looks like in practice
capture a short run
save
track.jsonor a diagnose bundleopen
stormlogload the artifact in
Diagnosticscompare ranks or review anomaly indicators
export a PNG or HTML timeline from
Visualizationsif you need to share the state
This is faster than trying to narrate a failure from logs alone.
3. CI or release owner triaging regressions
This is the workflow for answering:
did the new branch actually break behavior?
is the problem tied to one backend or environment?
what artifact should we attach to the PR or incident?
Use the maintained examples and scenario runners
Source checkout only. These commands require the repository
examples/package. Pip users should start with the CLI sequence in the practical starting point below.
python -m examples.cli.quickstart
python -m examples.cli.capability_matrix --mode smoke --target both --oom-mode simulated
Those commands are valuable because they already encode the repo’s intended smoke paths. They are a better starting point than hand-written one-off commands in CI comments.
When the smoke path fails
Move to:
gpumemprof diagnose --duration 0 --output ./diag_bundle
tfmemprof diagnose --duration 0 --output ./tf_diag
Then load the artifacts in the TUI or archive them for later review.
How the TUI fits the workflow
The TUI is not a replacement for the CLI. It is the place where saved or live data becomes easier to inspect.
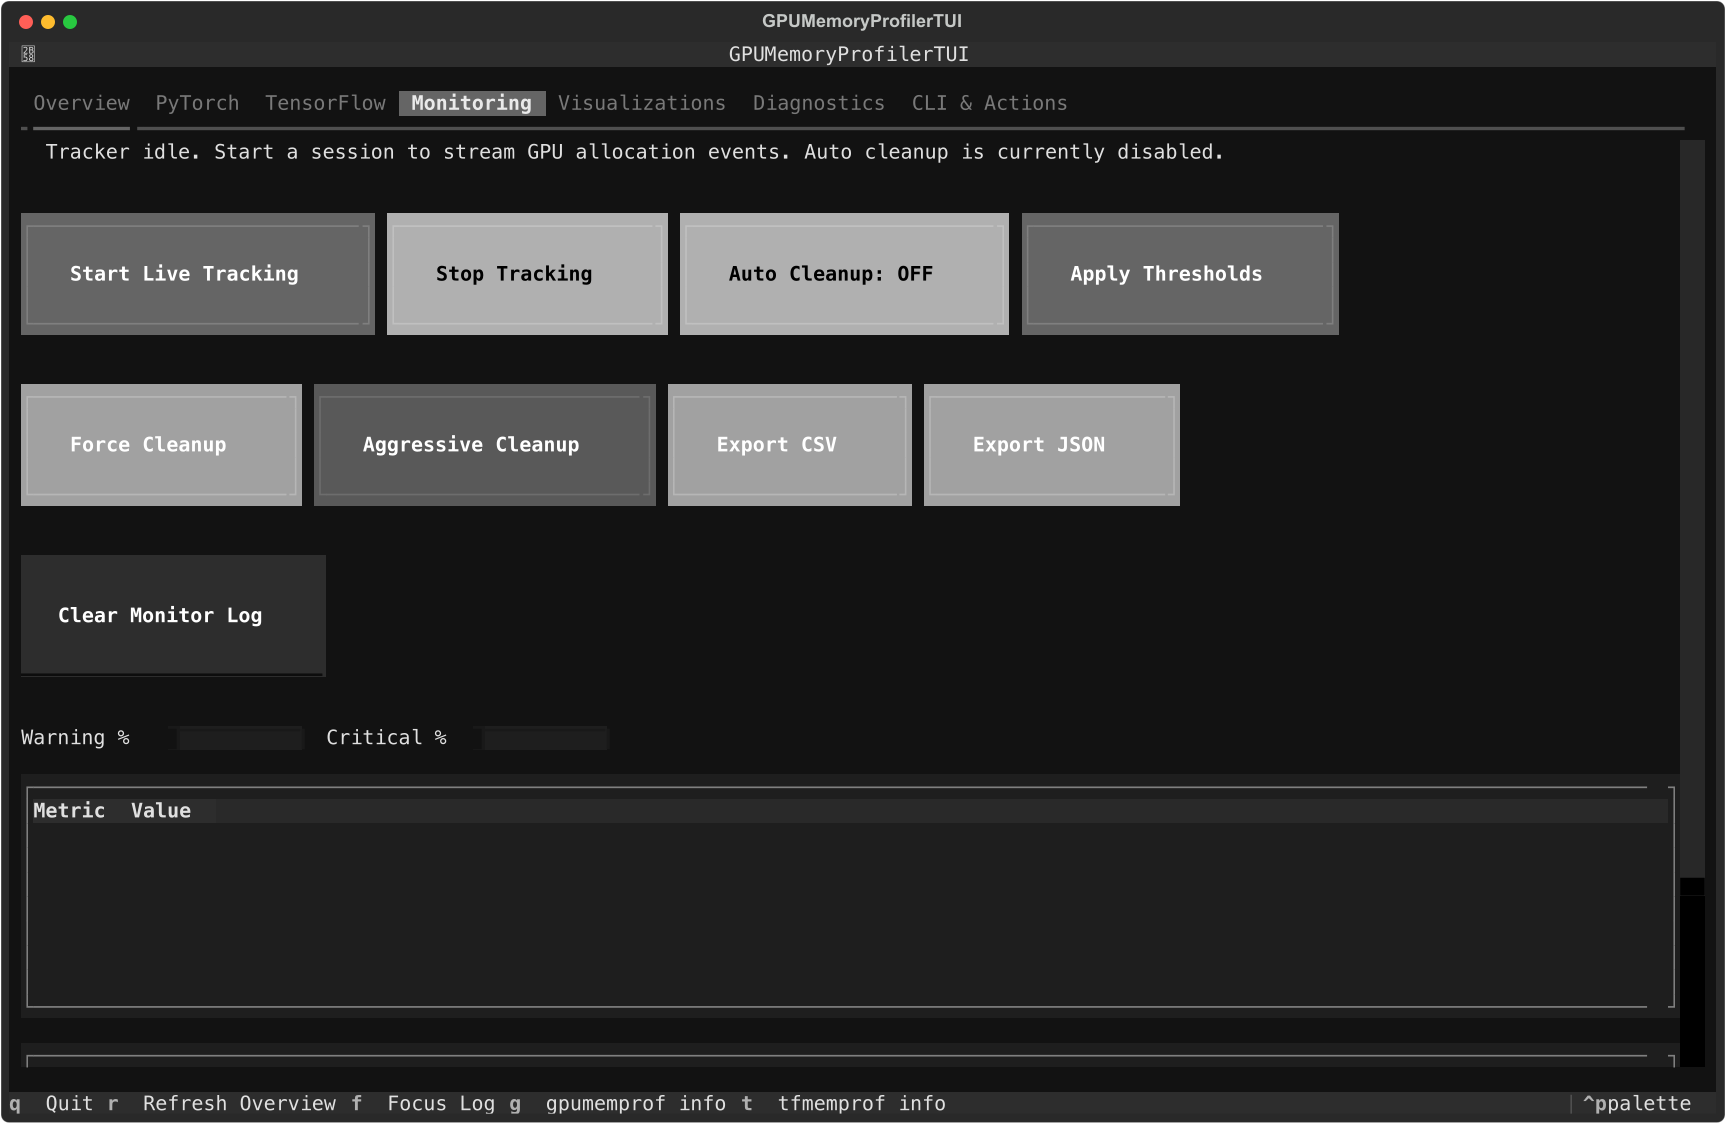
Monitoring tab
Use it when you want:
a live session without writing code
immediate CSV or JSON export
threshold adjustments in the same UI
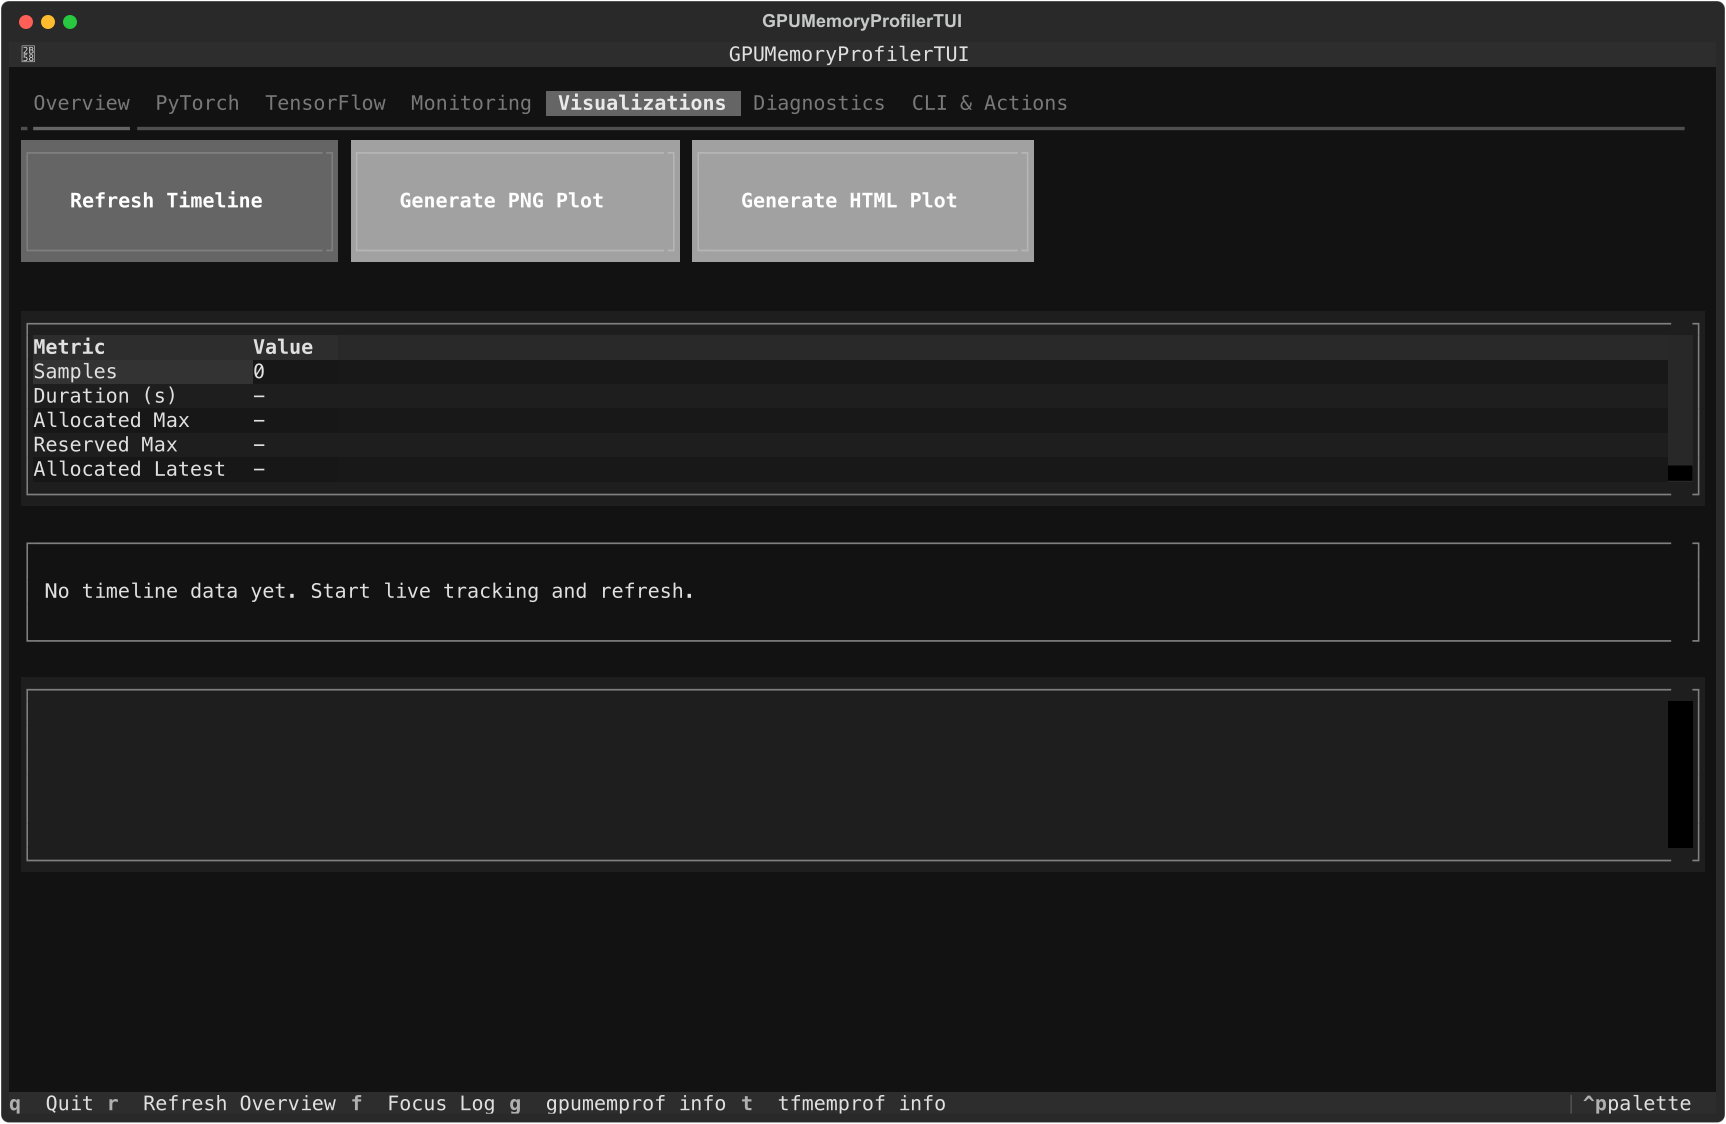
Visualizations tab
Use it when you want:
a quick terminal timeline
a PNG for documents or PRs
an HTML export for interactive review
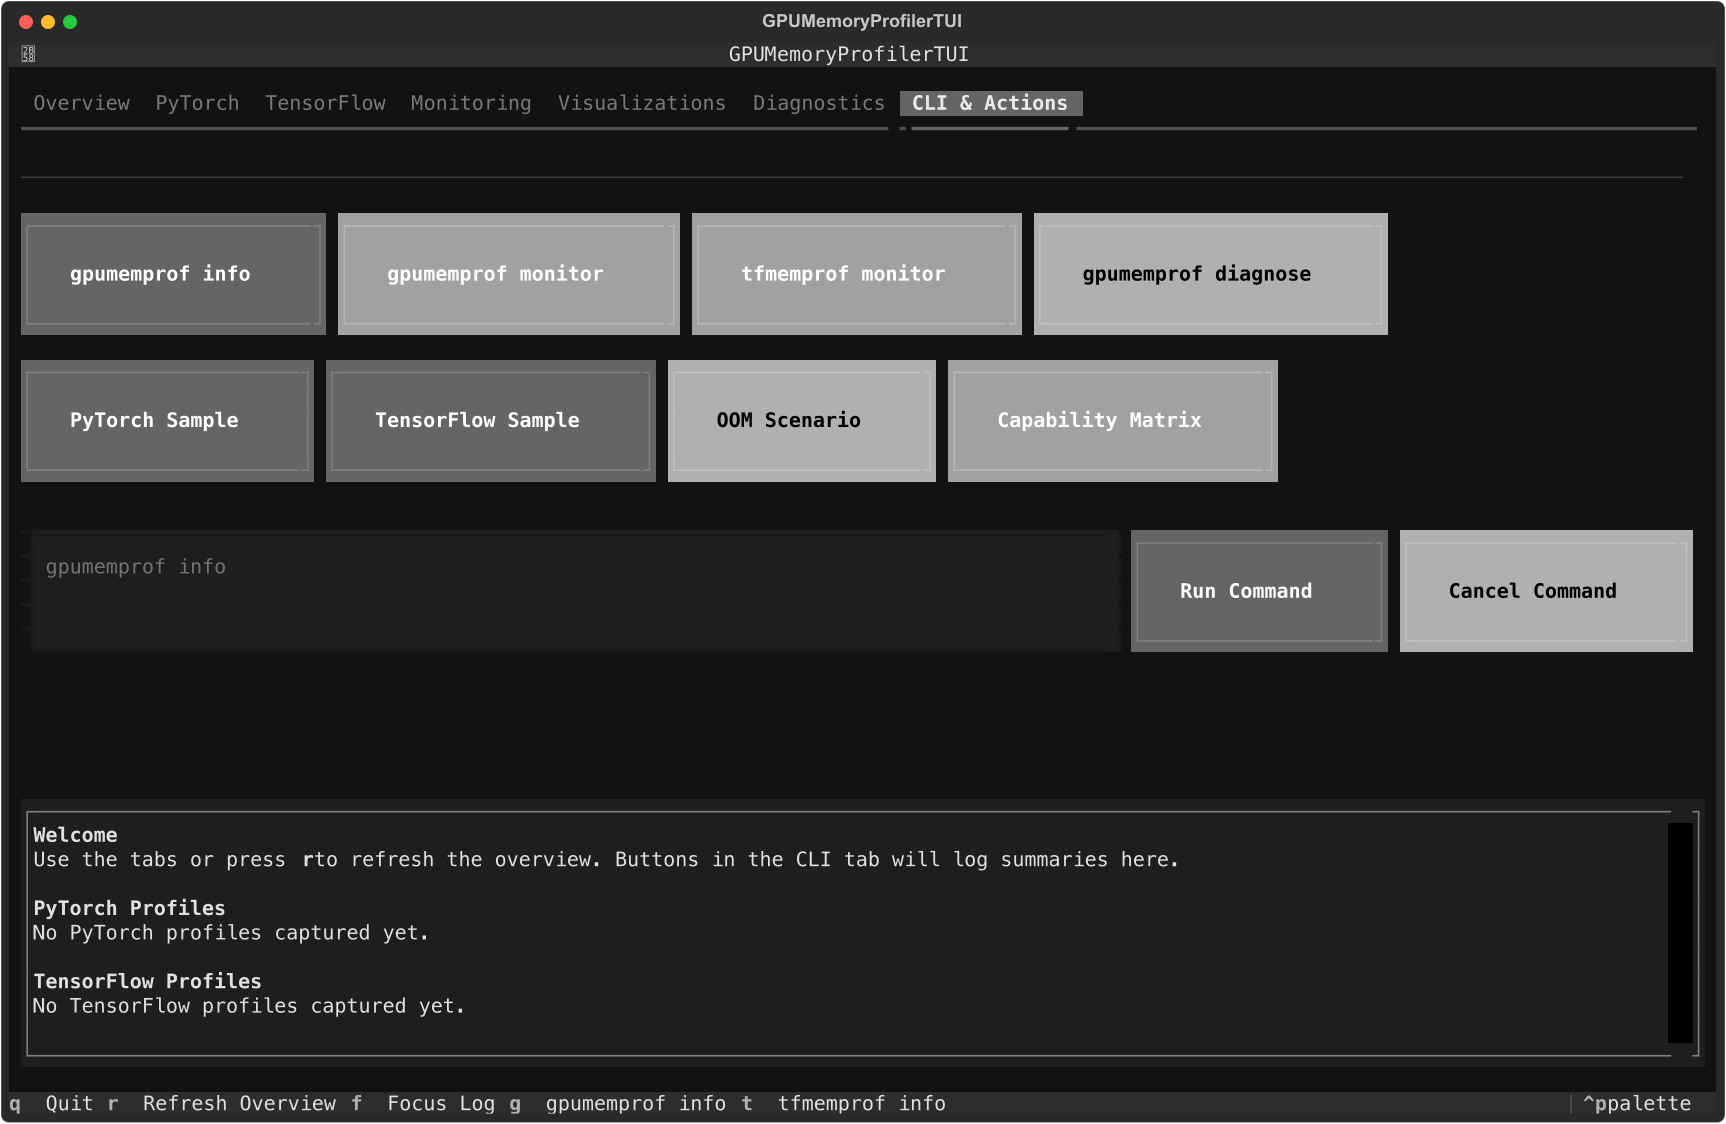
CLI & Actions tab
Use it when you want:
common commands without leaving the app
quick execution of example scenarios
a single place to keep command output attached to the same debugging session
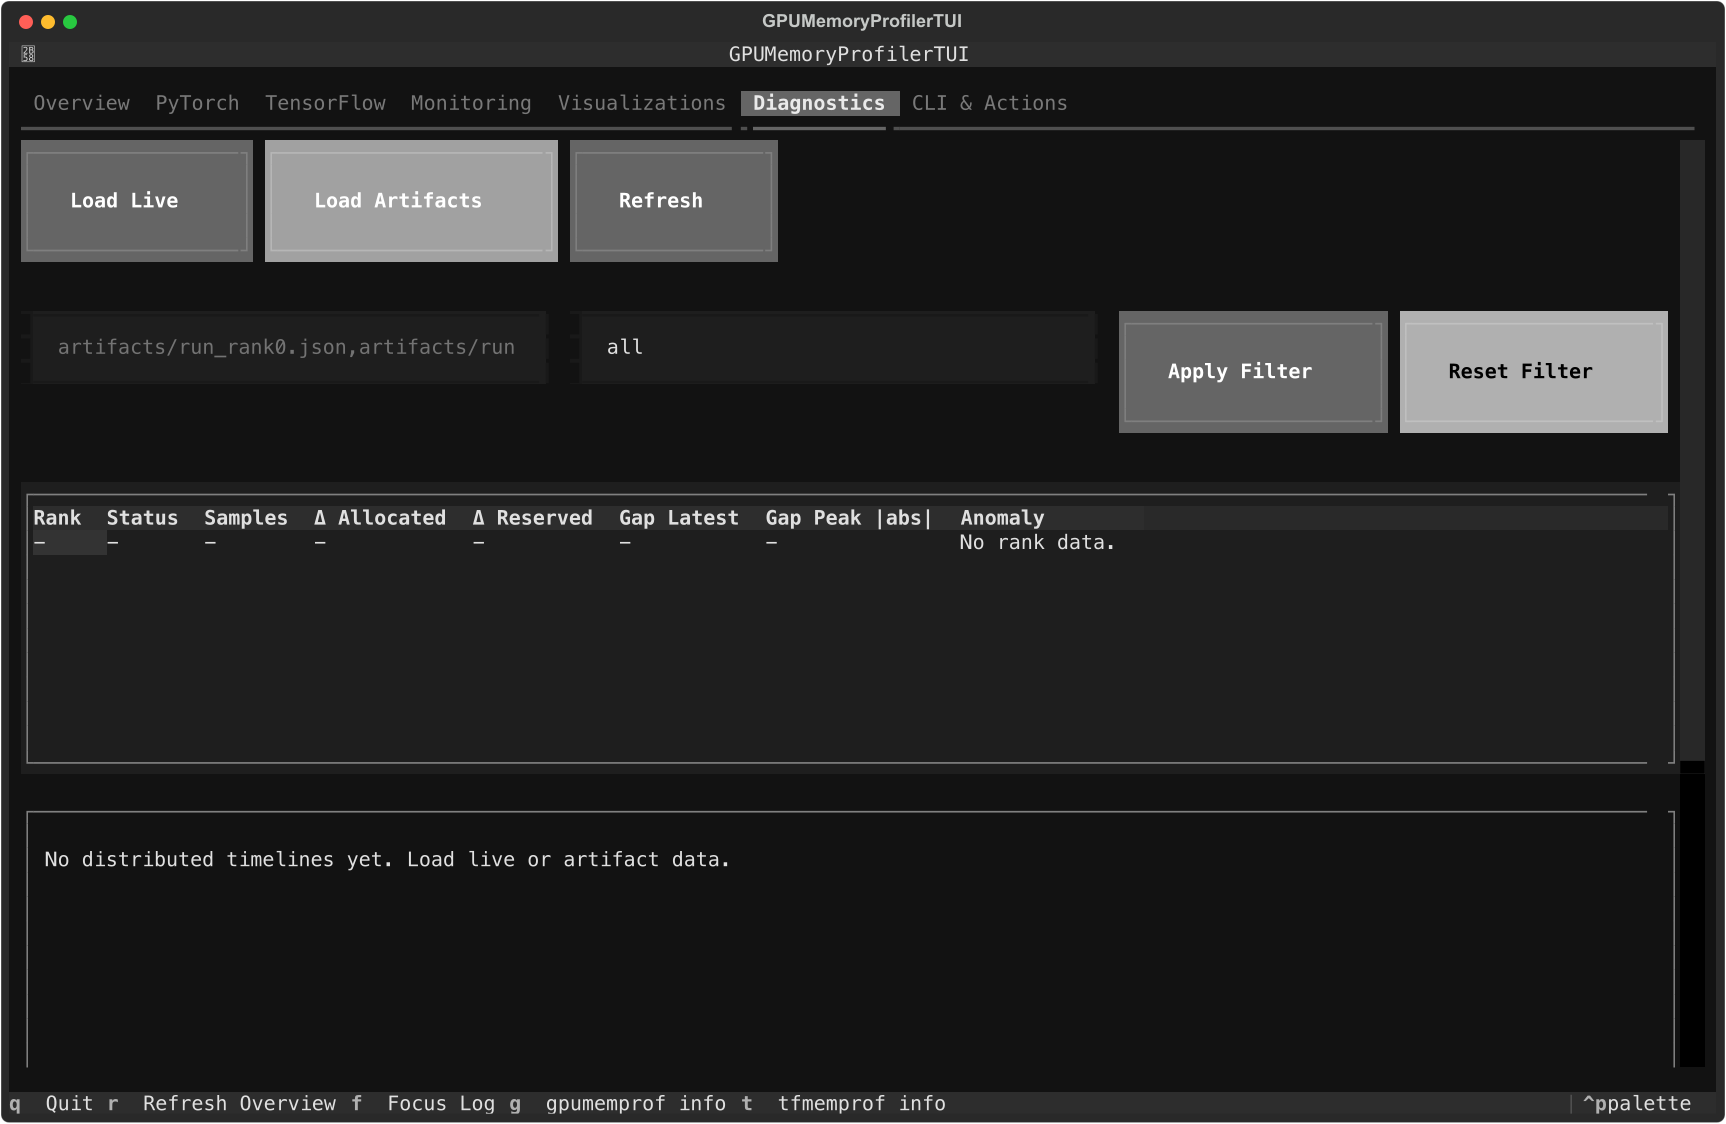
Distributed diagnostics
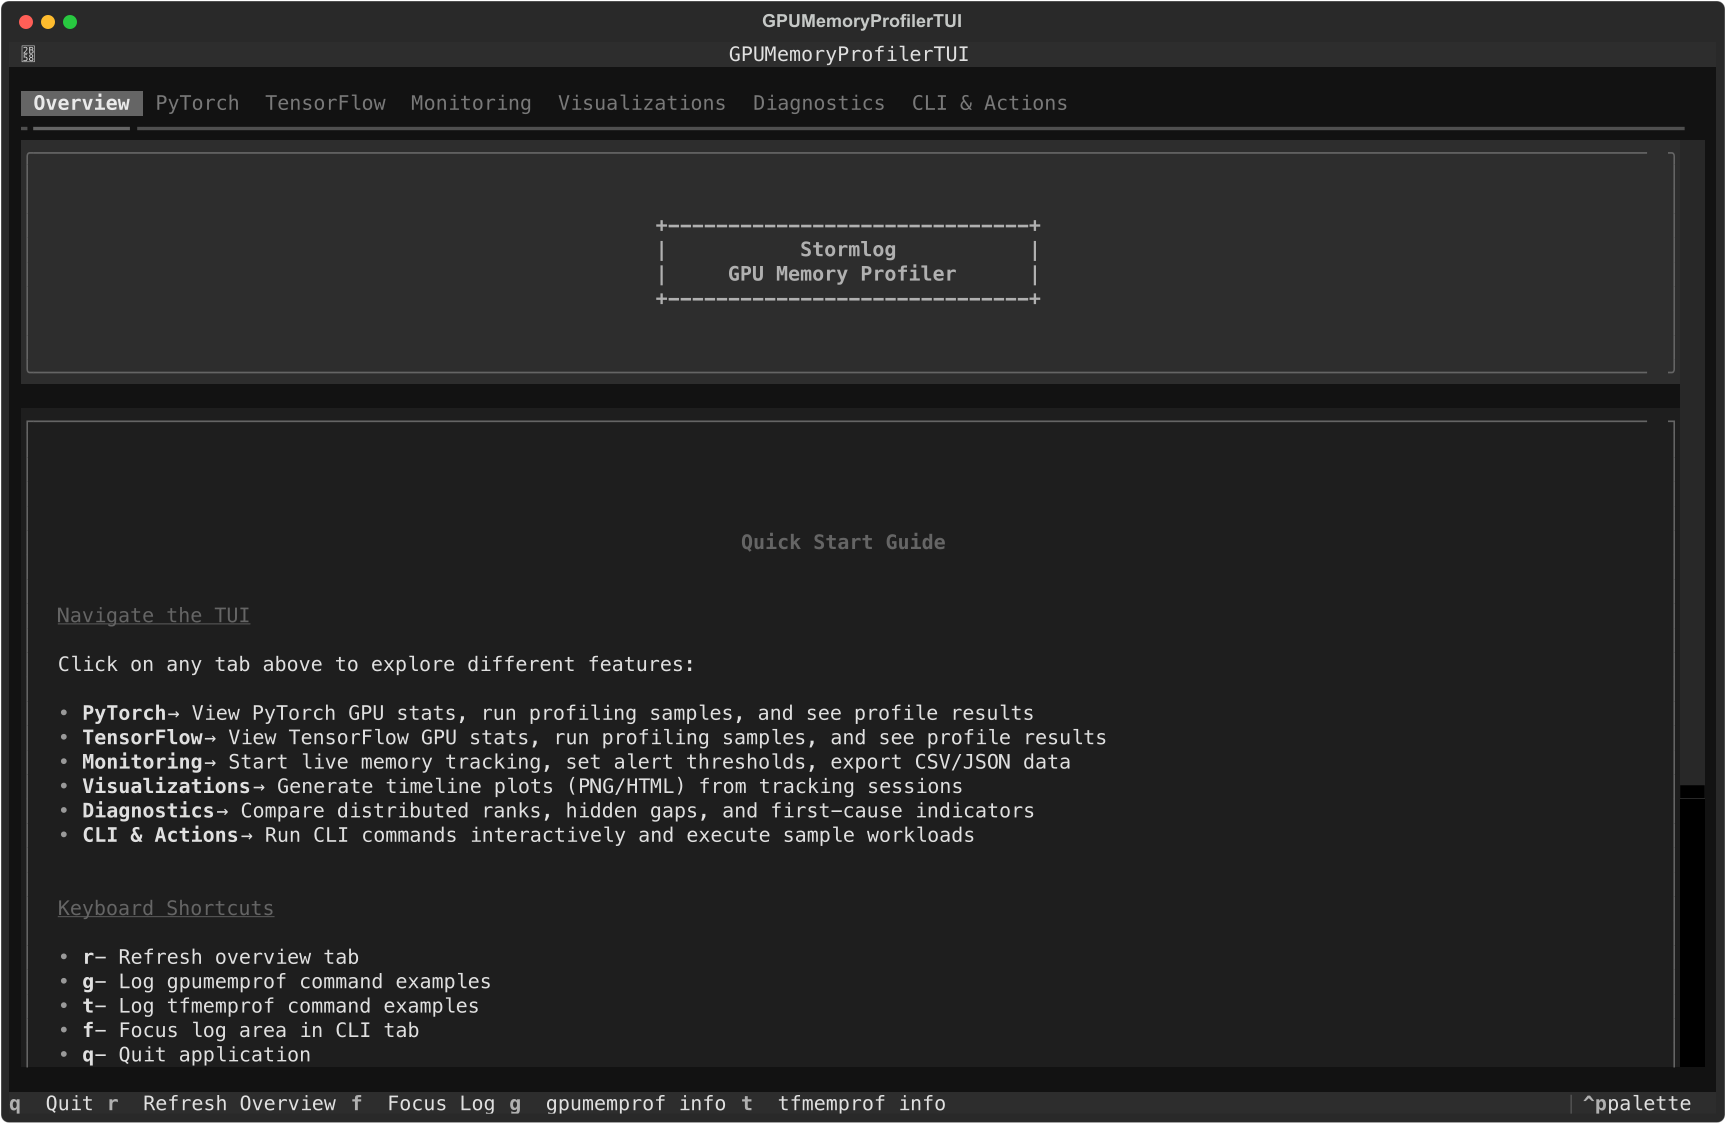
Distributed issues are usually not visible from a single rank summary. The current Diagnostics tab can load live telemetry or merged artifacts and rebuild rank-level summaries with filters and anomaly indicators inside the shipped UI shown earlier in this article.
Choosing the right surface
Stay in Python when
the issue is local to one operation
you are iterating quickly inside a notebook or training script
Use the CLI when
you need a portable artifact
you want to automate the check in CI
you want to capture a time-based signal instead of a single profile
Use the TUI when
you already have live telemetry or saved artifacts
you need a visual read on the run without leaving the terminal
you want to compare ranks or review exports interactively
What not to do
do not use screenshots as the source of truth when telemetry is available
do not document a workflow from memory when
--helpor the examples can confirm itdo not treat
GPUMemoryProfileras a CPU fallback; use the CPU profiler classes or CLI for that pathdo not assume
gpumemprof analyzeandtfmemprof analyzeaccept the same argument shape
A practical starting point
If you are unsure where to begin, use this order:
Start with the pip-safe CLI path:
gpumemprof info
gpumemprof track --duration 2 --interval 0.5 --output track.json --format json
gpumemprof analyze track.json --format txt --output analysis.txt
gpumemprof diagnose --duration 0 --output ./diag

tfmemprof info
tfmemprof diagnose --duration 0 --output ./tf_diag

# Optional TUI
pip install "stormlog[tui,torch]"
stormlog
If you are working from a source checkout, you can optionally add:
python -m examples.cli.quickstart
python -m examples.cli.capability_matrix --mode smoke --target both --oom-mode simulated
That sequence gives you:
environment truth
a minimal CLI smoke run
a broader release-style validation run
an interactive place to inspect the outputs
Next steps
Read the Usage Guide for the Python API path.
Read the CLI Guide for the automation path.
Read the TUI Guide for the terminal workflow.
Read the Testing and Validation Guide if you are attaching this to CI or release validation.